Four Peaks Consulting was given the task of determining where the Downtown Denver Partnership should place 170 new planters in Spring 2012. We worked within the Denver Business Improvement District (BID), excluding the 16th Street Mall, which is participating in a separate improvement plan. In our research, we found 14th Street and 15th Street between Market Street and Wynkoop Street to be participating in other redevelopment programs, so we limited proposals on these streets, as well. There were also several sidewalks in poor condition adjacent to surface parking lots where we limited the proposal of planters. In the following we will discuss our methodology for collecting data and conclusions for the proposed planters.
Map 1 - Business Improvement District (BID)
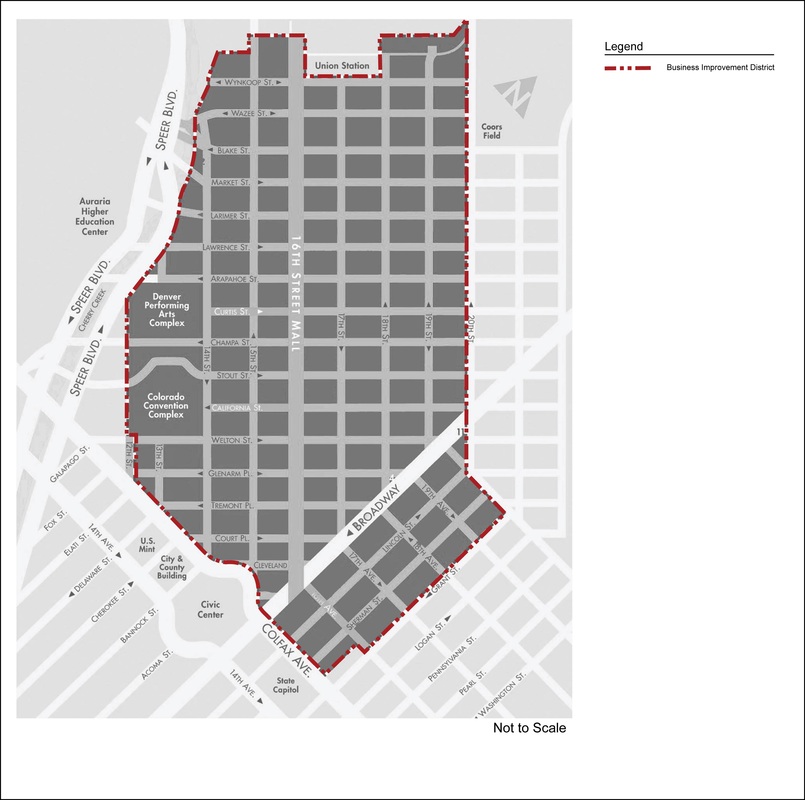
First, we decided to layer maps to visually represent each step we took. Our goal was to show existing planters and proposed planters. We started with a base map of the Business Improvement Zone (BID), highlighted here in red. (Click map for larger view).
Map 2 - Priority Streets

Downtown Denver Partnership is especially interested in encouraging walkability in the city, so we used the priority pedestrian streets as our primary target area for new planters. You will see the priority zones detailed in green in the accompanying map. Though this was our most important point of reference, we also reviewed other available data by overlaying it to see where additional overlaps occurred in determining planter location. (Click map for larger view).
Map 3 - Tax Paid Per Square Footage
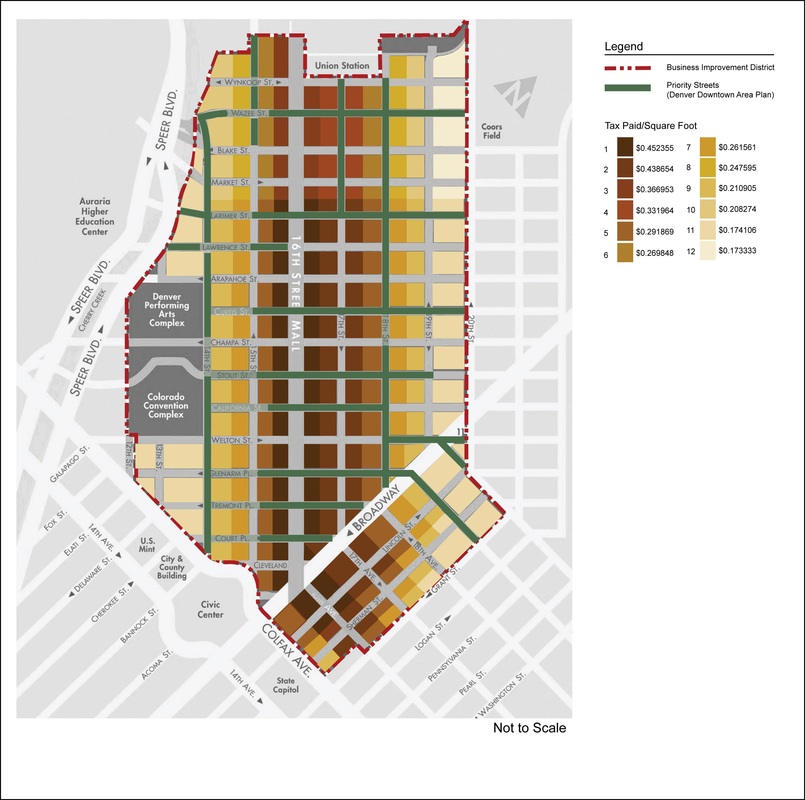
Next, we took into account the varying taxes paid by the different property owners in the BID. We were asked to take property owners that pay higher taxes into primary consideration. This can be seen in the brown gradient scale. The darker the shade, the more taxes were paid. This was a useful scale in narrowing down areas where we felt several planters may be beneficial. In overlaying this with the pedestrian walking zones, we had our prime target areas for new planters. (Click map for larger view).
Map 4 - Existing Planters

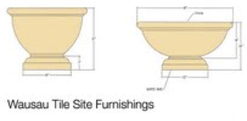
Existing planters were recorded in the following manner: First we took one overall photo to show context. Next, we took a photo of each planter at the site. To distinguish between tall and short planters, we placed a small token in the photos (click to view) We geotagged each planter as we went and made handwritten notes that included each picture number, the physical location, the number of planters at that location, and the sizes of the planters. This was very helpful, as geotagging was not entirely accurate. Once we uploaded all the pictures into Picasa, we refined each geotagged location. From this information we compiled and latitude and longitude into a spreadsheet (click to view). Then, we were able to create a Google map that shows all existing and proposed planters (click to view). Existing planters are shown here with green dots. Looking at Map 4, we are able to identify blocks of overlap in the relevant variables. We are also able to easily determine the blocks of Priority Streets that pay the highest taxes and do not have existing planters that are located within the Business Improvement District. (Click map for larger view).
Map 5 - Sidewalk Suitability

In addition to the variables shown in Map 4, we felt that a few more variables needed to be accounted for in order to make a determination of where the proposed planters would be located. The combination of Map 4 and these variables are what create the Sidewalk Suitability Categories.
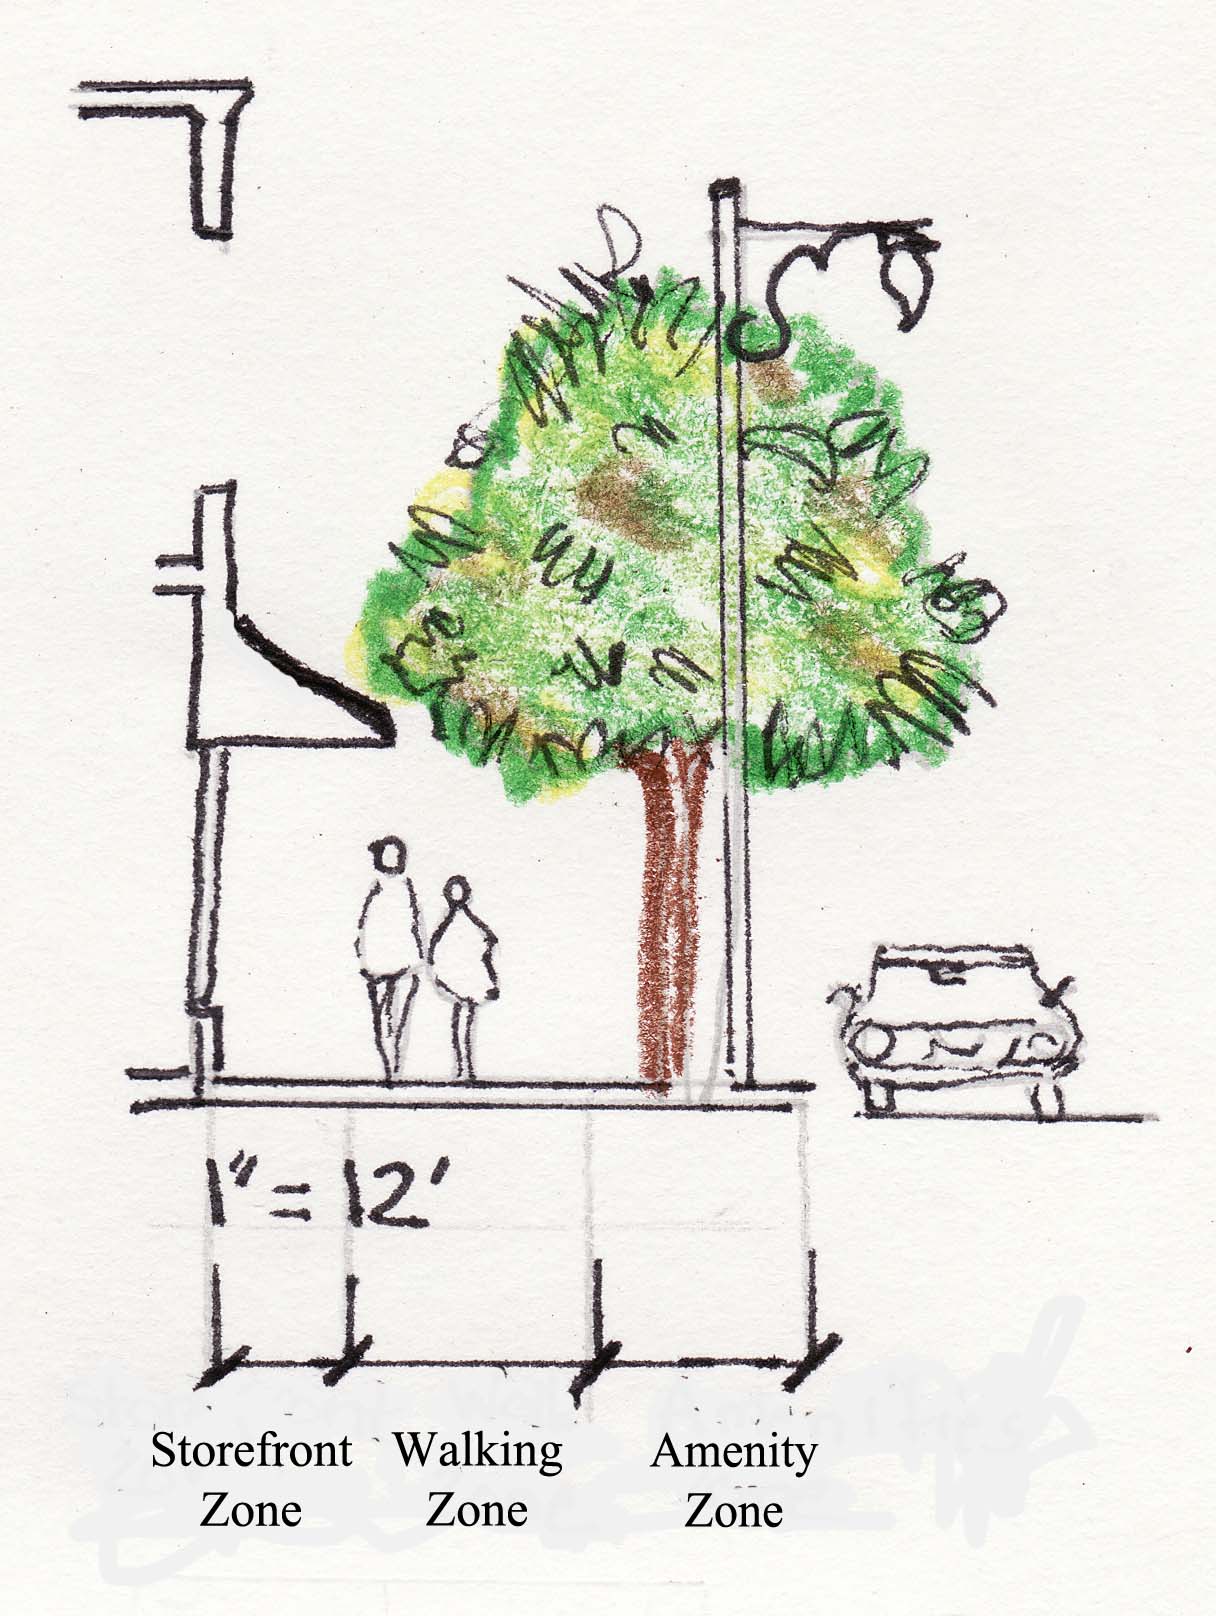
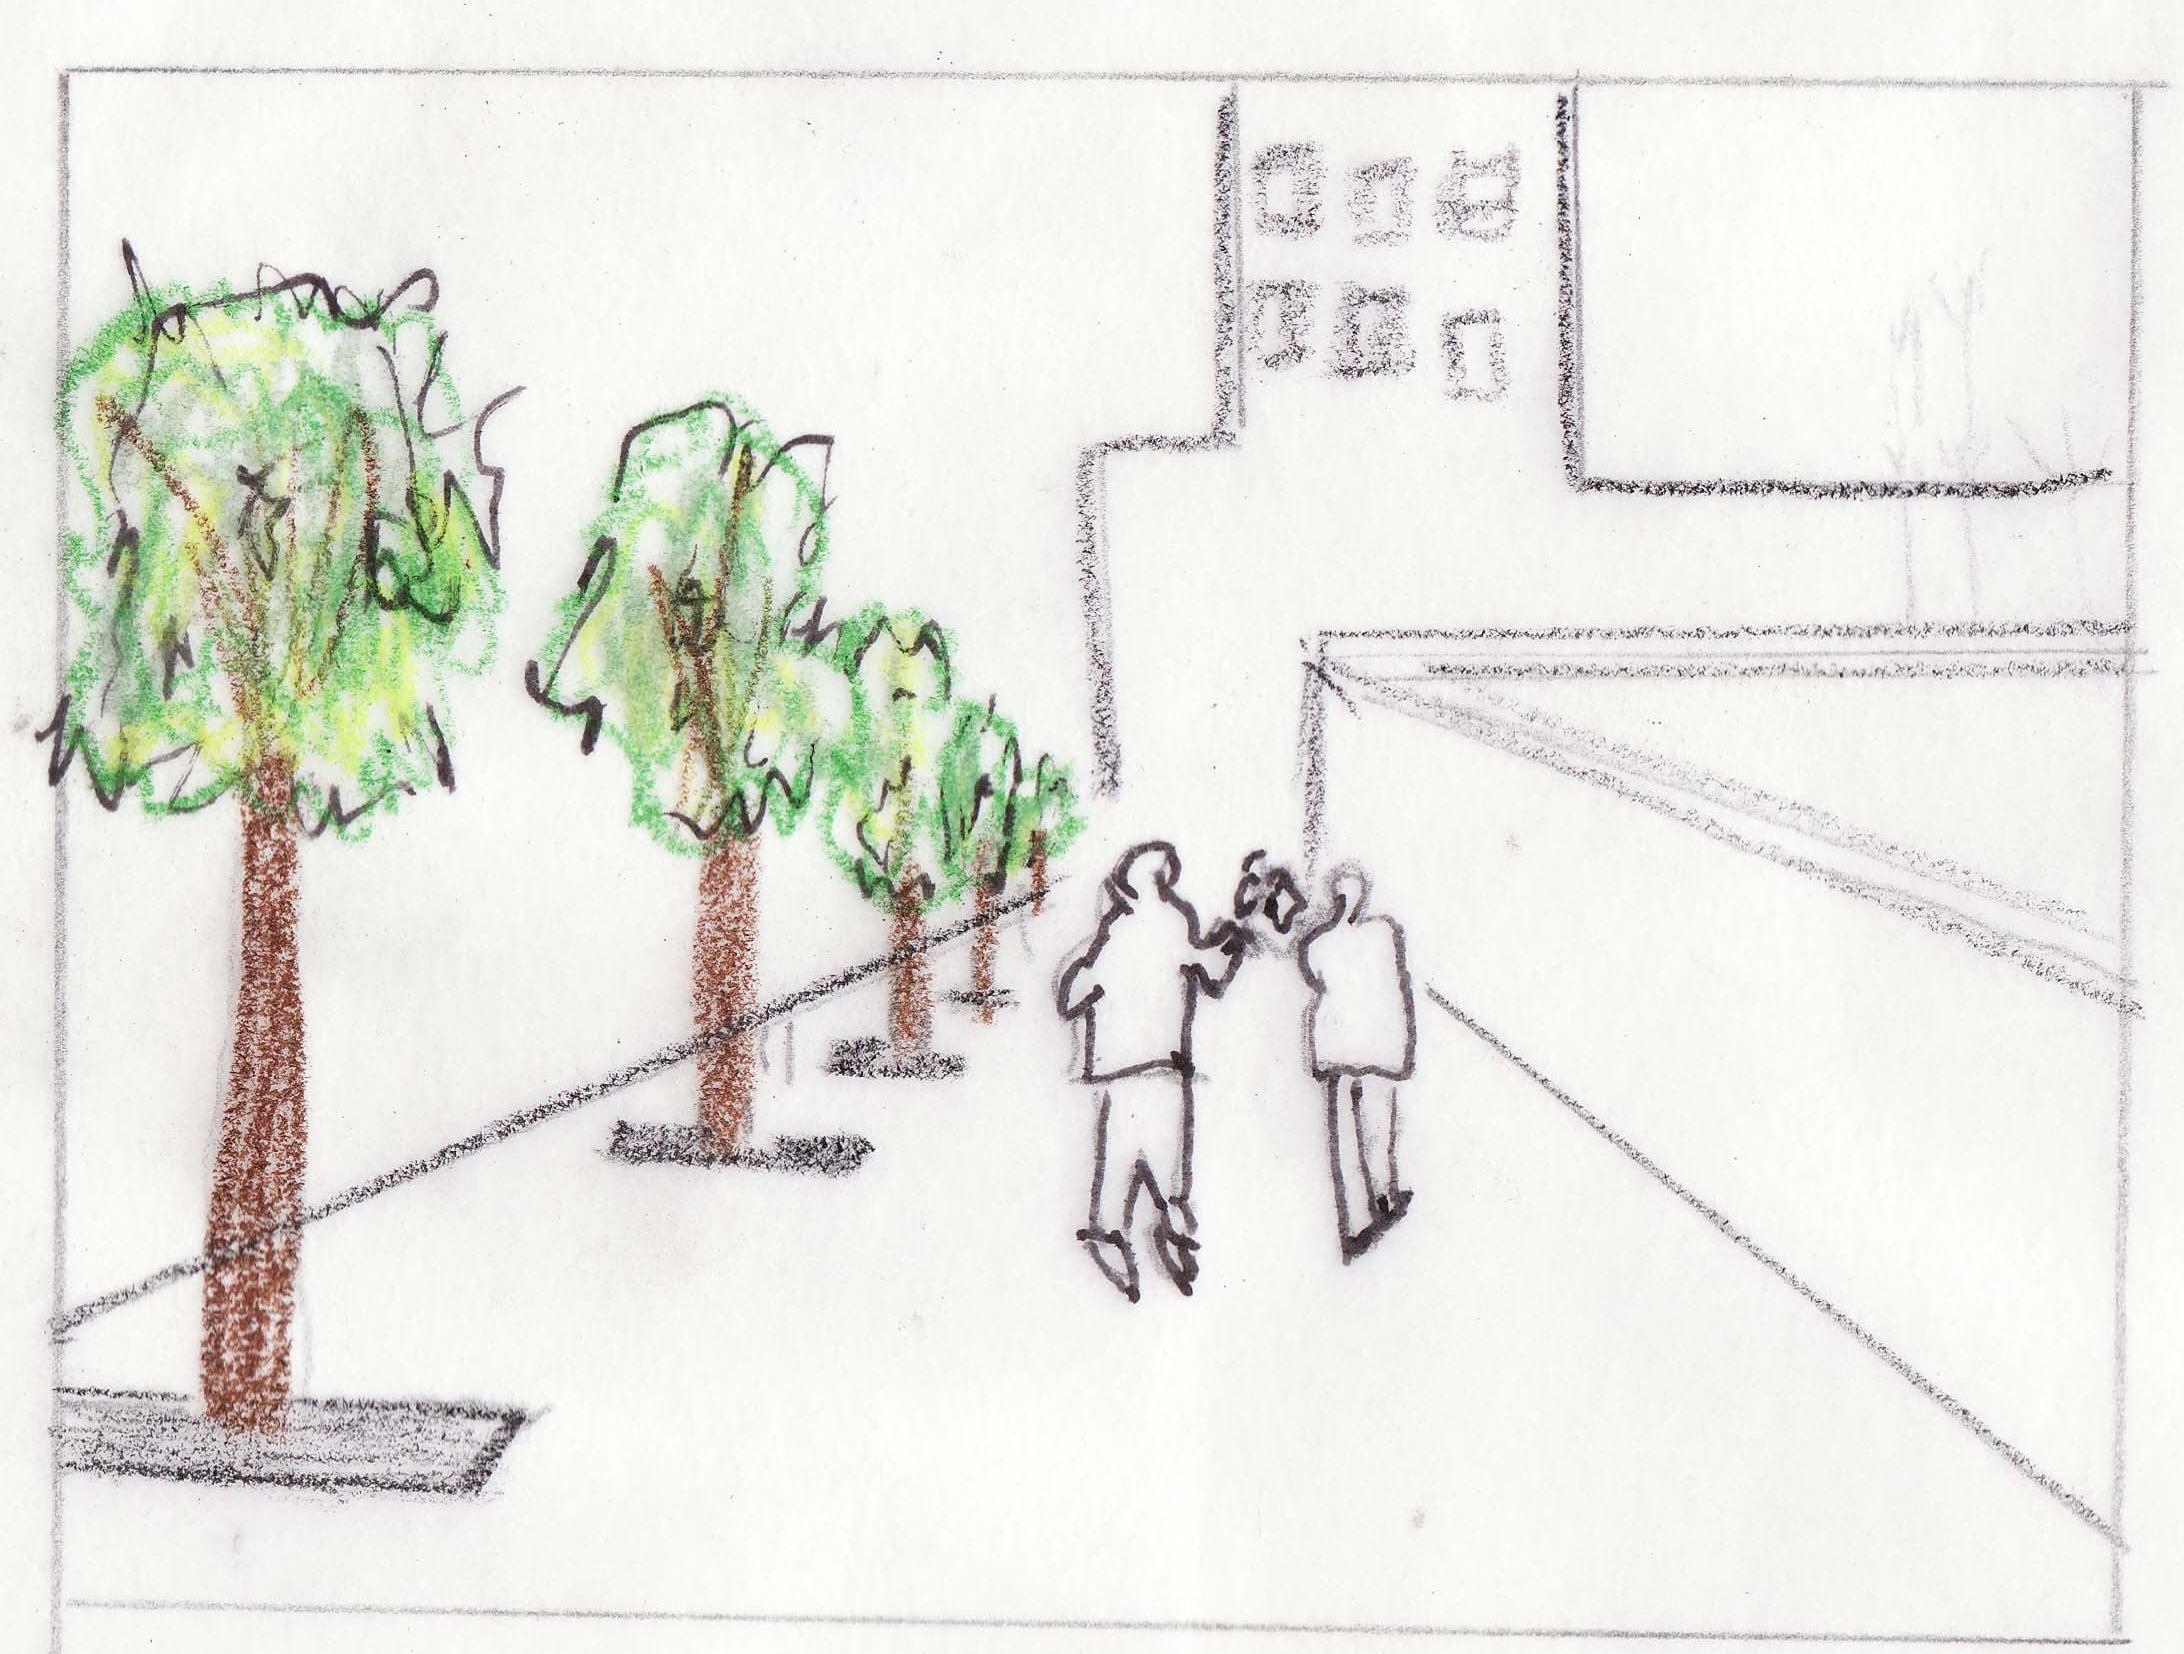
The first variable was the width and use of the sidewalk. After reviewing the improvement documents from the Downtown Alliance for Grand Rapids, MI (click to view), we established three sidewalk zones (click to view): Store/Business Use, Walkway/Pedestrian Use and Amenity Use.
The Store/Business Use encompasses the first 15% of the sidewalk closest to the storefront. This accommodates window shopping, store signage and movement in and out of the store.
The Walkway/Pedestrian Use accounts for the next 50% of the sidewalk to allow for obstruction free travel up and down the sidewalk (click to view).
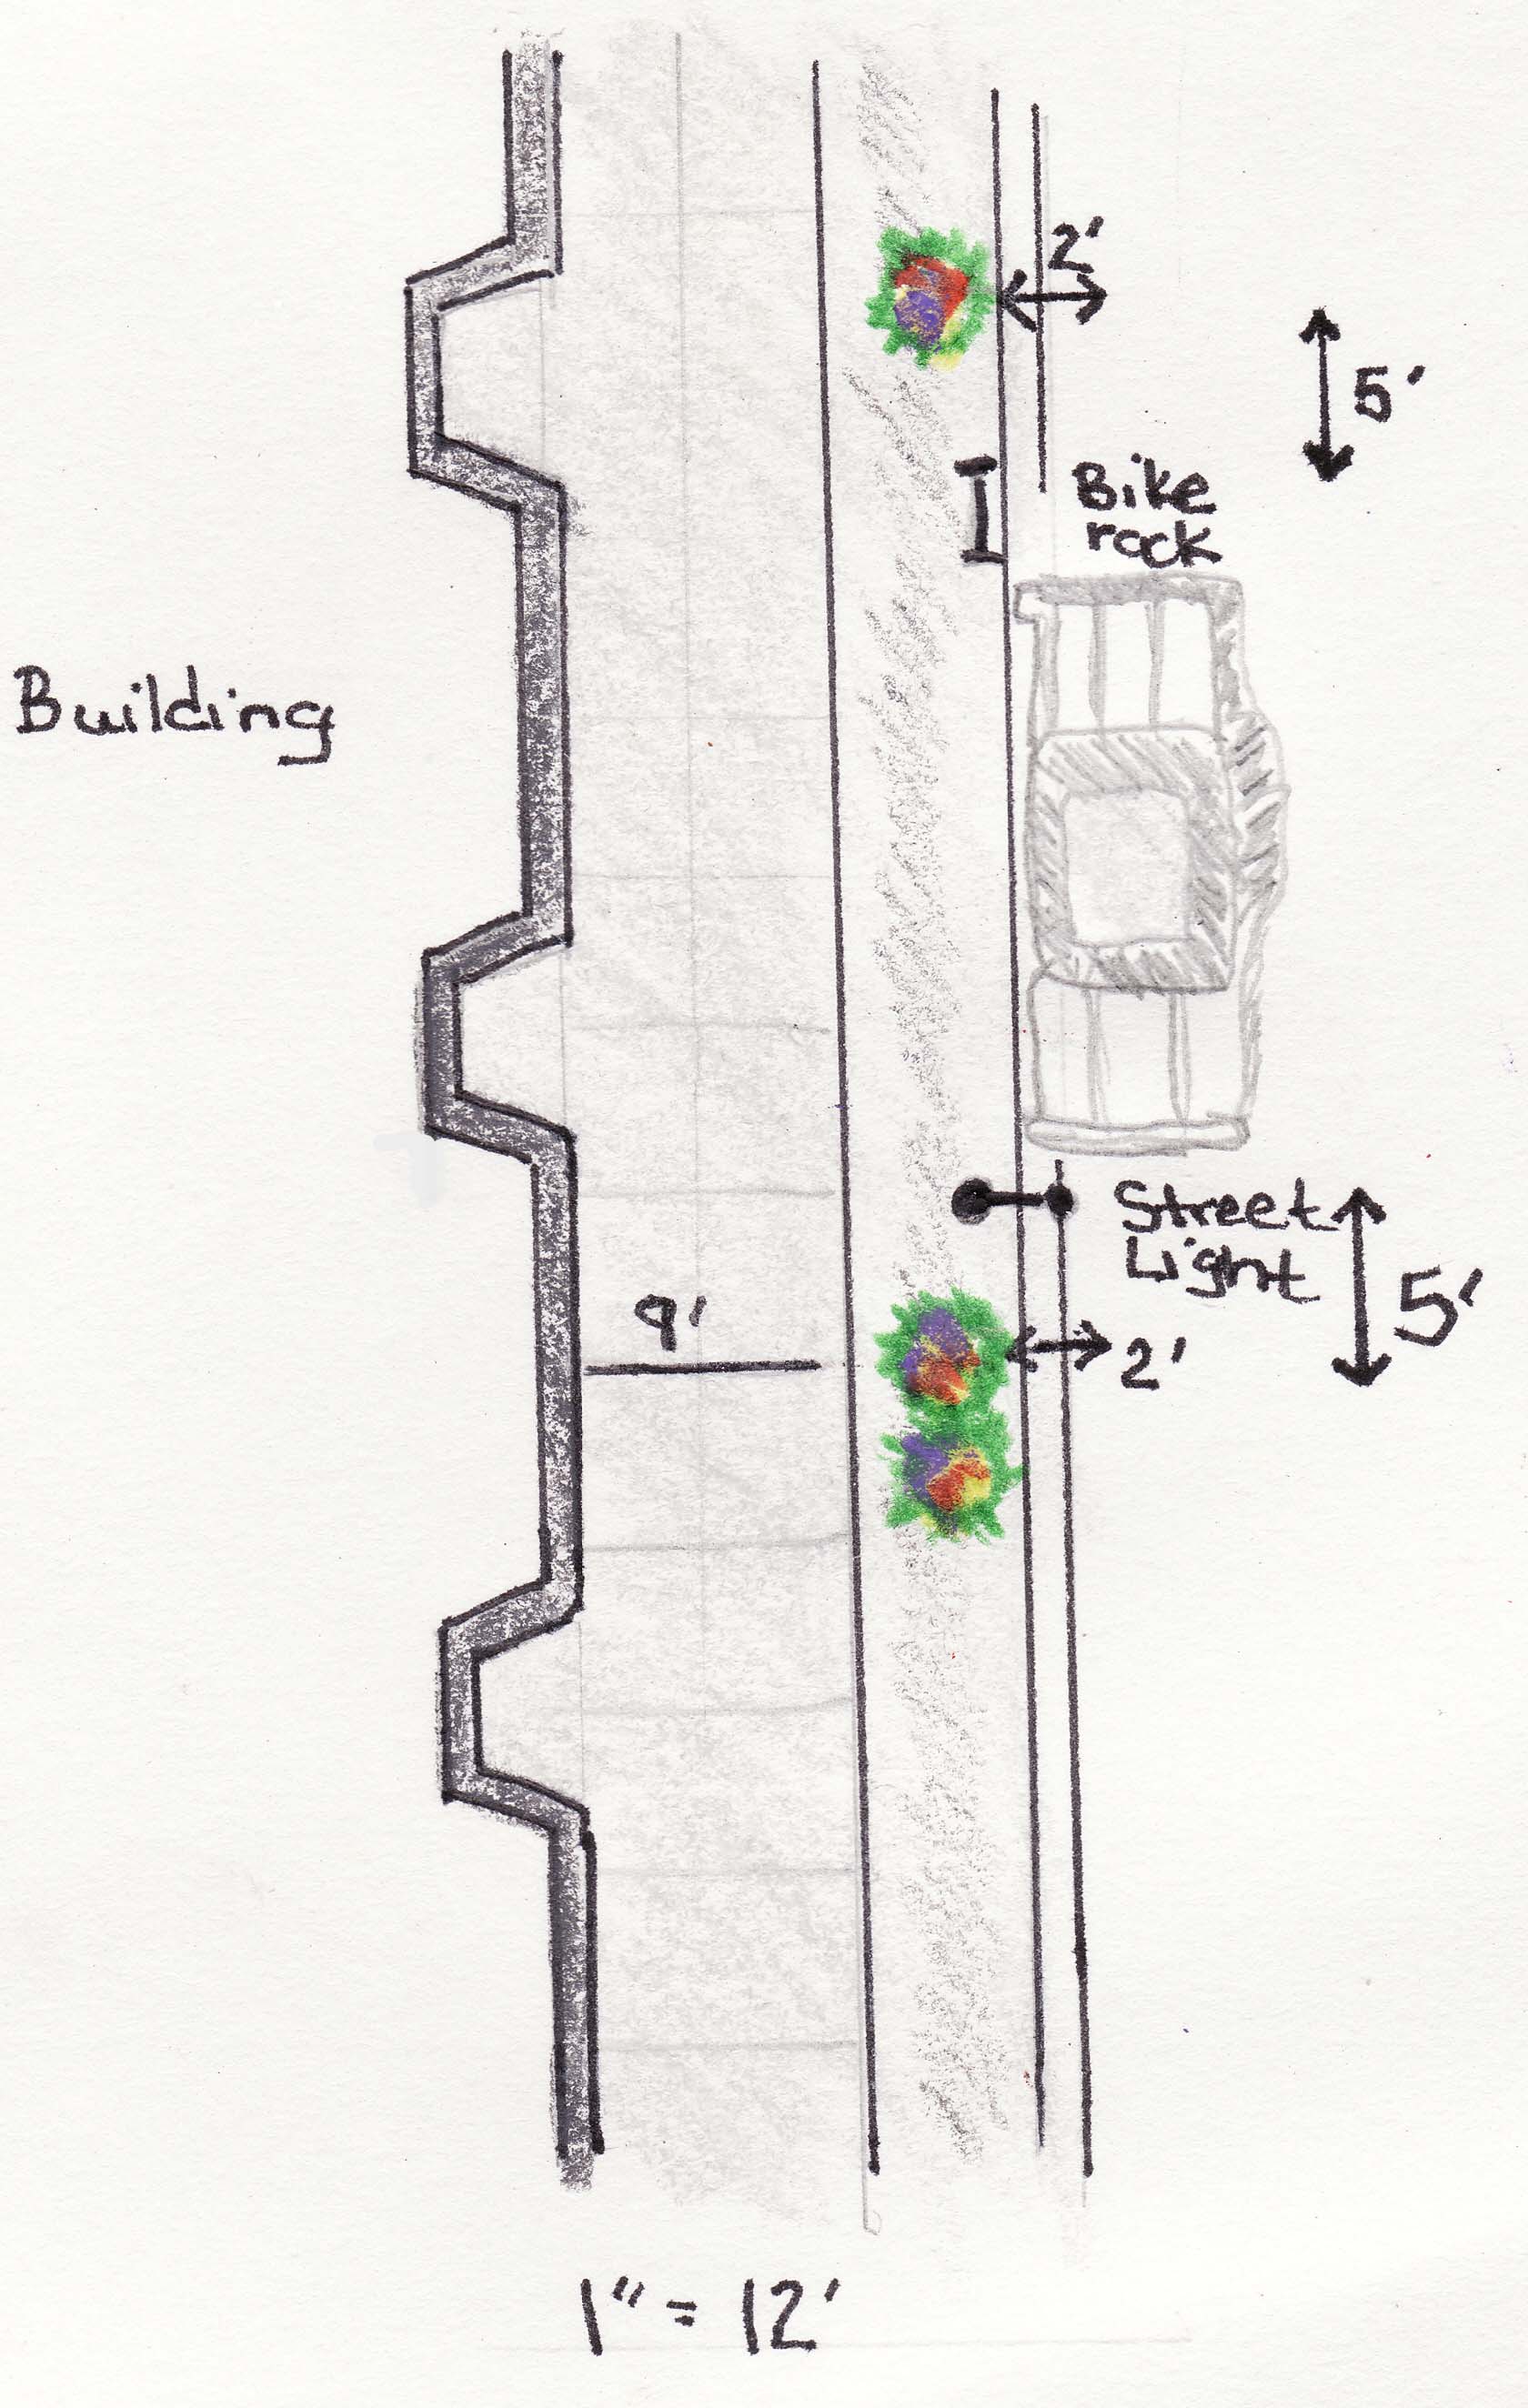
The final 35%, the area adjacent to the curb, is the Amenity Use which is used for loading/unloading from vehicles, newspaper stands, street lights, signage, street trees, bus stops, benches, trash receptacles and of course flower pots.
The width of the sidewalk determined the amount of space available for each use (click to view). Narrower sidewalks, <14’ were ranked lower than the wider sidewalks >18’ (The mean width was 18.6’). This was because narrower sidewalks had less room to accommodate all the necessary functions of an urban sidewalk.
In addition to these criteria, we also accounted for the amount of existing amenities already located on the sidewalk. Some areas that looked like appropriate locations for planters according to Map 4 had newspaper stands, benches and bus stops that occupied the majority of the Amenity Use area which would make locating a planter more difficult.
The last variable we wanted to consider was overall experience/impression; would a planter be appropriate here? Some of the areas that were excluded were areas adjacent to surface parking lots (unless there were building windows that looked down on it from across the street), elevated sidewalks with railings that broke apart the Amenity Use area from the Pedestrian Use, and areas directly outside of busy bars (where we noticed an abundance of trash and cigarette butts). Combining Map 4 with sidewalks zones, locations of existing amenities and overall impressions of the actual sidewalk informed us in creating the three categories of Sidewalk Suitability.
The categories are ranked from 1 to 3. 1 was the most suitable given the criteria discussed and 3 was the least suitable. These categories did not completely determine where all the planters were located, however these categories provided a way to visualize blocks that fell within our criteria. (Click map for larger view).
The first variable was the width and use of the sidewalk. After reviewing the improvement documents from the Downtown Alliance for Grand Rapids, MI (click to view), we established three sidewalk zones (click to view): Store/Business Use, Walkway/Pedestrian Use and Amenity Use.
The Store/Business Use encompasses the first 15% of the sidewalk closest to the storefront. This accommodates window shopping, store signage and movement in and out of the store.
The Walkway/Pedestrian Use accounts for the next 50% of the sidewalk to allow for obstruction free travel up and down the sidewalk (click to view).
The final 35%, the area adjacent to the curb, is the Amenity Use which is used for loading/unloading from vehicles, newspaper stands, street lights, signage, street trees, bus stops, benches, trash receptacles and of course flower pots.
The width of the sidewalk determined the amount of space available for each use (click to view). Narrower sidewalks, <14’ were ranked lower than the wider sidewalks >18’ (The mean width was 18.6’). This was because narrower sidewalks had less room to accommodate all the necessary functions of an urban sidewalk.
In addition to these criteria, we also accounted for the amount of existing amenities already located on the sidewalk. Some areas that looked like appropriate locations for planters according to Map 4 had newspaper stands, benches and bus stops that occupied the majority of the Amenity Use area which would make locating a planter more difficult.
The last variable we wanted to consider was overall experience/impression; would a planter be appropriate here? Some of the areas that were excluded were areas adjacent to surface parking lots (unless there were building windows that looked down on it from across the street), elevated sidewalks with railings that broke apart the Amenity Use area from the Pedestrian Use, and areas directly outside of busy bars (where we noticed an abundance of trash and cigarette butts). Combining Map 4 with sidewalks zones, locations of existing amenities and overall impressions of the actual sidewalk informed us in creating the three categories of Sidewalk Suitability.
The categories are ranked from 1 to 3. 1 was the most suitable given the criteria discussed and 3 was the least suitable. These categories did not completely determine where all the planters were located, however these categories provided a way to visualize blocks that fell within our criteria. (Click map for larger view).
Map 6 - Proposed Planters
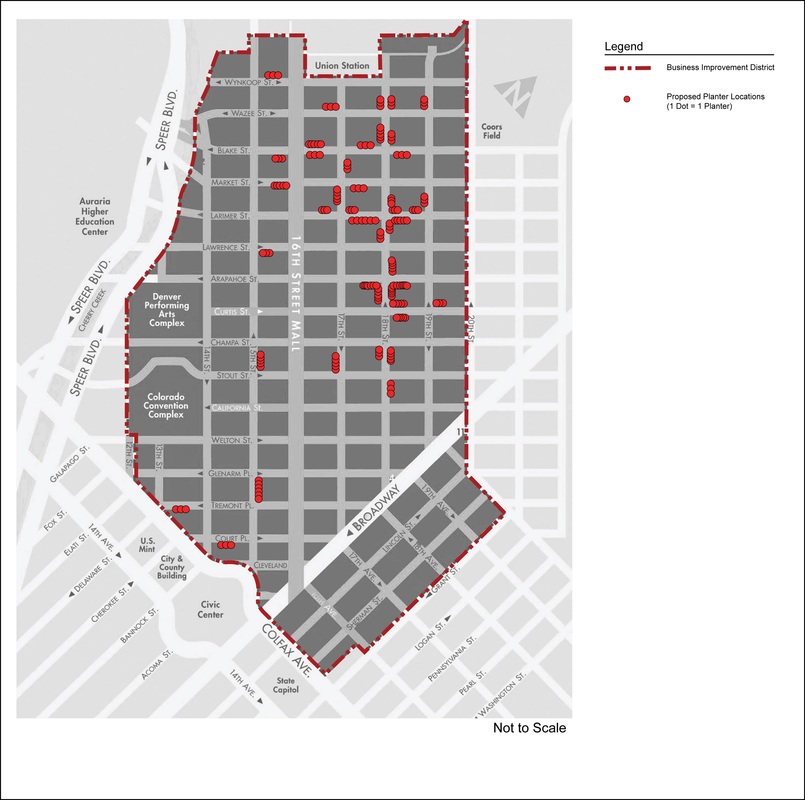
William H. Whyte, in his book, City: Rediscovering the Center states, "The greatest urban spaces are the street corners." They are a clear, direct, and safe place for pedestrians to cross streets and they are the most social places within the city center. It is an interesting point in which we agreed and saw that many of existing planters followed (click to view).
Using the guidelines and data above, we propose 46 sites for planters, which can be seen as red dots on the map. We planned for a combination of 3 or 5 planters of varying sizes in these locations. The groups of 3 planters would be arranged with 2 tall and 1 short planter; whereas the groups of 5 would contain 2 tall and 3 short planters. The quantities selected were based of space constraints within zones and distribution of planters evenly throughout the business district. Through our field studies and a review of existing data, we feel the proposed sites are the locations that best satisfy the given variables. (Click map for larger view).
Using the guidelines and data above, we propose 46 sites for planters, which can be seen as red dots on the map. We planned for a combination of 3 or 5 planters of varying sizes in these locations. The groups of 3 planters would be arranged with 2 tall and 1 short planter; whereas the groups of 5 would contain 2 tall and 3 short planters. The quantities selected were based of space constraints within zones and distribution of planters evenly throughout the business district. Through our field studies and a review of existing data, we feel the proposed sites are the locations that best satisfy the given variables. (Click map for larger view).

